
Page 35 - Vellore Institute of Technology – Annual Report 2016-17
P. 35
VIT University Annual Report 2016-17
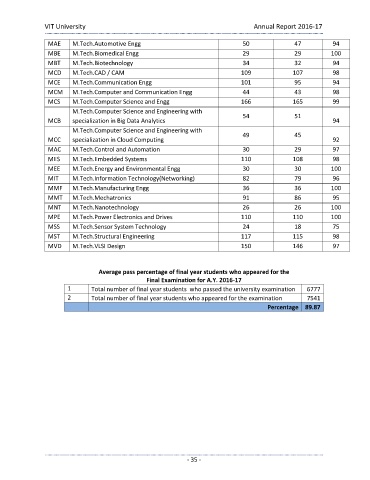
MAE M.Tech.Automotive Engg 50 47 94
MBE M.Tech.Biomedical Engg 29 29 100
MBT M.Tech.Biotechnology 34 32 94
MCD M.Tech.CAD / CAM 109 107 98
MCE M.Tech.Communication Engg 101 95 94
MCM M.Tech.Computer and Communication Engg 44 43 98
MCS M.Tech.Computer Science and Engg 166 165 99
M.Tech.Computer Science and Engineering with
54 51
MCB specialization in Big Data Analytics 94
M.Tech.Computer Science and Engineering with
49 45
MCC specialization in Cloud Computing 92
MAC M.Tech.Control and Automation 30 29 97
MES M.Tech.Embedded Systems 110 108 98
MEE M.Tech.Energy and Environmental Engg 30 30 100
MIT M.Tech.Information Technology(Networking) 82 79 96
MMF M.Tech.Manufacturing Engg 36 36 100
MMT M.Tech.Mechatronics 91 86 95
MNT M.Tech.Nanotechnology 26 26 100
MPE M.Tech.Power Electronics and Drives 110 110 100
MSS M.Tech.Sensor System Technology 24 18 75
MST M.Tech.Structural Engineering 117 115 98
MVD M.Tech.VLSI Design 150 146 97
Average pass percentage of final year students who appeared for the
Final Examination for A.Y. 2016-17
1 Total number of final year students who passed the university examination 6777
2 Total number of final year students who appeared for the examination 7541
Percentage 89.87
- 35 -