
Page 32 - Vellore Institute of Technology – Annual Report 2017-18
P. 32
Vellore Institute of Technology – Annual Report 2017-18
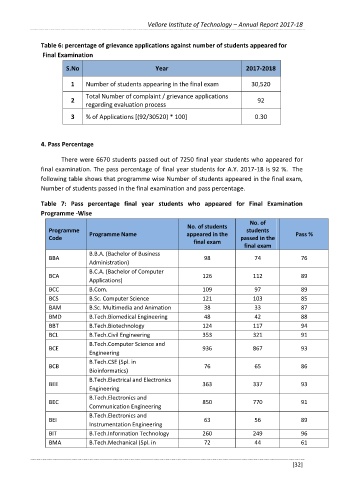
Table 6: percentage of grievance applications against number of students appeared for
Final Examination
S.No Year 2017-2018
1 Number of students appearing in the final exam 30,520
Total Number of complaint / grievance applications
2 92
regarding evaluation process
3 % of Applications [(92/30520) * 100] 0.30
4. Pass Percentage
There were 6670 students passed out of 7250 final year students who appeared for
final examination. The pass percentage of final year students for A.Y. 2017-18 is 92 %. The
following table shows that programme wise Number of students appeared in the final exam,
Number of students passed in the final examination and pass percentage.
Table 7: Pass percentage final year students who appeared for Final Examination
Programme -Wise
No. of
No. of students
Programme Programme Name appeared in the students Pass %
Code passed in the
final exam
final exam
B.B.A. (Bachelor of Business
BBA 98 74 76
Administration)
B.C.A. (Bachelor of Computer
BCA 126 112 89
Applications)
BCC B.Com. 109 97 89
BCS B.Sc. Computer Science 121 103 85
BAM B.Sc. Multimedia and Animation 38 33 87
BMD B.Tech.Biomedical Engineering 48 42 88
BBT B.Tech.Biotechnology 124 117 94
BCL B.Tech.Civil Engineering 353 321 91
B.Tech.Computer Science and
BCE 936 867 93
Engineering
B.Tech.CSE (Spl. in
BCB 76 65 86
Bioinformatics)
B.Tech.Electrical and Electronics
BEE 363 337 93
Engineering
B.Tech.Electronics and
BEC 850 770 91
Communication Engineering
B.Tech.Electronics and
BEI 63 56 89
Instrumentation Engineering
BIT B.Tech.Information Technology 260 249 96
BMA B.Tech.Mechanical (Spl. in 72 44 61
[32]